
.png)

A judoka hanging by a thread, INSEP, France, 2023 | ABOUT TEDDY RINER et Clarisse Agbegnenou |
Trajectories Trajectories
Data visualization & Data art
Sport
2023
Customer
National Institute of Sport, Expertise and Performance [INSEP]
Event
European College
of Sport Science 2023 [ECSS]
Paris Convention Center
Science Festival
Museum of Man
Data and AI Fair
Nantes Convention Centre
Police station
Marthe Viallet
Project management
Marthe Viallet
Adrien Marck
Jeremy Wanner
Communication
and Graphic Design
INSEP
Data artists
Benoit Pimpaud
Karim Douieb
Krisztina Szűcs
Laura Castro
University of Nantes
Rémi Carmigniani
Chloé Fouillot
Stats Perform
Kirk Goldsberry
Jeremy Wanner
SEP
Julie Brunet
Issa Moussa
Quentin De Larochelambert
Adrien Sedeaud
Julien Schipman
Guillaume Saulière
Data artists
Benoit Pimpaud
Karim Douieb
Krisztina Szűcs
Laura Castro
University of Nantes
Rémi Carmigniani
Chloé Fouillot
Stats Perform
Kirk Goldsberry
Jeremy Wanner
SEP
Julie Brunet
Issa Moussa
Quentin De Larochelambert
Adrien Sedeaud
Julien Schipman
Guillaume Saulière

Exhibition venue
Paris Convention Center
Located at Place de la Porte Maillot in the 17th arrondissement, the Palais des Congrès is situated between the Arc de Triomphe and the Grande Arche de La Défense. It hosts major congresses and shows.
Exhibition Venue
Paris Convention Center
Located at Place de la Porte Maillot in the 17th arrondissement, the Palais des Congrès sits between the Arc de Triomphe and the Grande Arche de La Défense. It hosts some of the largest congresses and shows.
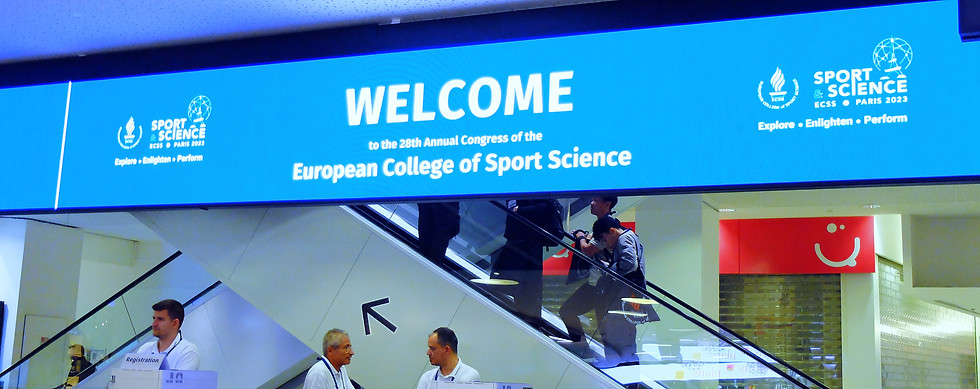
Event
28th Congress of the European College of Sport Science
Organised from 4 to 7 July 2023, the 28th Congress of the ECSS, an international organisation, brings together nearly 3,000 participants and speakers to exchange ideas on the theme of sports science.
Event
8th Congress of the European College of Sport Science
Held from July 4 to 7, 2023, the 28th ECSS Congress is an international event bringing together nearly 3,000 participants and speakers to exchange insights on the theme of sports science.
Event
28th Congress of the European College of Sport Science
Organised from 4 to 7 July 2023, the 28th Congress of the ECSS, an international organisation, brings together nearly 3,000 participants and speakers to exchange ideas on the theme of sports science.
Event
8th Congress of the European College of Sport Science
Held from July 4 to 7, 2023, the 28th ECSS Congress is an international event bringing together nearly 3,000 participants and speakers to exchange insights on the theme of sports science.
INTENTION / PURPOSE
Intention
Purpose
#ArtAndScience
#SportsData
#InnovativeVisuals
I was approached by INSEP (National Institute of Sport, Expertise and Performance) to design a pioneering data visualization exhibition. Inspired by my past projects, INSEP entrusted me with the mission of elevating sports data visualizations, transforming them into true works of art. My ambition for them: to elevate data to the status of a creative medium, where scientists, data designers, and sports enthusiasts can become digital artists for the duration of the exhibition. Today, data visualization plays a key role in improving athletic performance. In elite sports, the collection and analysis of vast amounts of data have become ubiquitous. Representing this data in an accessible way, for both coaches and the general public, is a central challenge in sports science. The exhibition showcases large-format visualizations, away from screens, to bring them to life and make them accessible to everyone, here and now.
As the exhibition curator and project manager, I was approached by INSEP to create a pioneering data-visualization exhibition. Based on my previous projects, INSEP entrusted me with the task of elevating sports data visualizations into true works of art. My ambition was to recognize data as a creative medium, where scientists, data designers, and sports enthusiasts could become digital artists for a moment. Today, data visualization plays a key role in enhancing sports performance. In elite-level disciplines, the collection and analysis of large amounts of data have become ubiquitous. Representing this data in an accessible way, both for coaches and the general public, is a central challenge in sports science. The exhibition showcases large-format visualizations, taking them far from the screens to make them come alive, here and now.
team
Team Team

Marthe Viallet
Exhibition Curator
and Project Manager
INDEPENDENT

Adrien Marck
PhD | Head of Open-Innovation & Tech Transfer
INSEP

Adrien Sedeaud
PhD | Sports Scientist | Deputy Director of IRMES
INSEP

Jeremy Wanner
Data scientist
Performance Unit
INSEP / INDEPENDENT

François-Xavier Mas
Editorial project manager
INSEP
Artistic Bias
Curatorial Choices
Hybridity
Hybrid Approach

We exhibited large-format data visualizations, created both by INSEP research laboratories and by data designers, data journalists or sports data enthusiasts.
We exhibited large-format data visualizations created both by INSEP research laboratories and by data designers, data journalists, or sport data enthusiasts.
Diversity
Diversity

The exhibition highlighted diversity: in the sports represented, whether individual or team-based; in gender, with the presence of female athletes and authors; and in the types of visualizations selected for the quality of the data presented and a high level of design.
The exhibition highlighted diversity: in the sports represented, whether team or individual; in gender, with the presence of female athletes and authors; and in the types of visualizations selected for the quality of the data presented and a high level of design.
THE
NUMBERS
FACTS & FIGURES

Number of Dataviz / Number Of Dataviz
15

Attendance / Attendance
3000+

Sports represented / Fields of study
10

Max Length / Max Dataviz Length
4m
Trajectories
Trajectories
The first strides of a sprinter or the glide of a swimmer, the movements of boxers or basketball players, the regular monitoring of physiological and psychological indicators, or even the performances achieved during an entire career, the notion of trajectory is asserted in performance sport in all its diversity and polysemy.
Through a variety of graphic representations, the exhibition explores current methods and future possibilities for illustrating these trajectories. It also highlights the limitations and potential biases of visualizations, while inviting visitors to reflect on the beauty and complexity of these representations.


The INSEP's Trajectory exhibition is currently touring several events across France. Once its tour is complete, I will be able to share the project and its content in detail. In the meantime, discover some glimpses from its various stops.
The Trajectories exhibition, is currently on tour across various events in France. Once the tour is complete, I will be able to share the full project and its content in detail. In the meantime, catch a glimpse of it at its upcoming stops.


Gallery
Gallery
All content presented in this virtual exhibition, including texts, images, graphics, and data visualizations, is protected by copyright and intellectual property rights. Any unauthorized reproduction, distribution, modification, or use of this content is strictly prohibited without the prior written consent of INSEP, Marthe Viallet, and the authors of the exhibited works.
We thank you for respecting these rights and thus contributing to the appreciation of the creative and intellectual work of our team and collaborators. For any requests for permission or further information, please contact me via the contact form.
Legal notices and intellectual property protection
From unpacking the artworks to hanging them up, each step is an adventure shared with the host institution.
We're not at the Louvre (yet) here! :)
But each project is handled with the utmost care.
I personally oversee every detail, supervising and actively participating in the installation.
Follow me on this adventure where I wear all the hats: commissioner, project manager, handler and much more.
WANT TO SEE ANOTHER EXHIBITION?
Want to continue your exploration? Browse our other exhibitions to discover different aspects of data visualization and their many applications .


WANT TO SEE ANOTHER EXHIBITION?
Want to continue your exploration? Browse our other exhibitions to discover different aspects of data visualization and their many applications .


BEHIND THE SCENES
Rent the exhibition!
This exhibition maps the links that unite us, whether familial, professional, artistic or scientific, providing a perfect backdrop for any networking event or professional meeting.
Contact me to discover this customizable rental service.
WANT TO SEE ANOTHER EXHIBITION?
Want to continue your exploration? Browse our other exhibitions to discover different aspects of data visualization and their many applications .
Create your own exhibition
Do you have a project in mind? Let's collaborate to create a unique exhibition that will showcase your data and tell your story in a visually engaging way.